
Financial reporting automation is the use of connectors, rules engines, robotic process automation (RPA), and AI/ML models to move data from source systems through validation, consolidation, and report generation without manual intervention at each step. The payoff is real and measurable: finance teams that automate core reporting workflows close faster, produce fewer errors, and redirect analyst hours toward the forecasting and strategic work that actually moves the business.
Here is the honest three-line verdict before you go any further:
- Faster close, fewer errors, more analysis time are the consistent wins. Automation handles the repetitive data-assembly work so your team can focus on interpretation.
- The primary risk is scaling bad data. Automation amplifies whatever is already in your systems, good or bad. Governance comes first, tooling second.
- Your immediate next step: scope a 30–60 day pilot on one high-volume, low-complexity process (trial balance ingestion or account reconciliation), or schedule a scoping call with a vendor or custom automation partner this week.
Key Takeaways
Financial reporting automation delivers its fastest and most durable ROI when governance comes before tooling and pilots stay narrow before they scale.
| Point | Details |
|---|---|
| Automate rule-based tasks first | Trial balance ingestion and account reconciliation are the highest-impact, lowest-complexity pilot candidates for most finance teams. |
| Governance before tooling | Audit and clean your source data before connecting any automation pipeline; bad data scales faster than good data. |
| Pilot in 30–60 days | A parallel run on one entity and one process is enough to validate the system and make a go/no-go decision. |
| Track three KPI categories | Measure process efficiency (close cycle time), data quality (error rate, audit trail completeness), and business impact (analyst hours reallocated). |
| Vendor evaluation is non-negotiable | Require SOC 2 Type II certification, a demonstrable audit trail, and a reference client before signing any contract. |
| Ctrlaltorion for custom builds | Ctrlaltorion scopes and builds targeted reporting automations for small and mid-size teams, reducing processing time from hours to minutes. |
Table of Contents
- What does financial reporting automation actually cover?
- How does an automated reporting system actually work?
- Which parts of financial reporting should you automate first?
- What are the real benefits, and how do you calculate ROI?
- What risks should you prepare for before you start?
- What features should you evaluate in an automation platform?
- How do you run a low-risk 30–60 day pilot?
- Which KPIs prove that automation is working?
- A real-world example: from hours to minutes
- What questions should you ask every vendor?
- What should your 30, 60, 90 day plan look like?
- What I’ve seen work for small and mid-size finance teams
- Ctrlaltorion builds the reporting automation your team will actually use
- Sources
What does financial reporting automation actually cover?
IBM defines financial reporting automation as the process of collecting, processing, analyzing, reporting, and reviewing financial data through technology rather than manual effort, freeing FP&A teams for strategic work. That scope is broader than most teams initially assume, and narrower in a few important ways.
What automation typically covers:
- Trial balance ingestion and chart-of-accounts mapping
- Account reconciliations and auto-matching of transactions
- Intercompany eliminations and multi-entity consolidation
- Month-end management pack generation (P&L, balance sheet, cash flow)
- Disclosure templates and regulatory filing drafts
- Scheduling, formatting, and delivery of reports to stakeholders
What automation does not replace:
- Final judgment calls on discretionary accounting estimates (impairments, reserves, fair value)
- Governance sign-off and CFO/controller review before filing
- Audit responses that require professional interpretation
- Decisions about accounting policy changes
Three misperceptions worth correcting before you build a business case. First, automation does not eliminate human review; it changes what humans review (exceptions and edge cases, not routine data assembly). Second, automated output is not automatically compliant; you still need governance controls and a documented approval workflow. Third, “automated” does not mean “instant” on day one; the first 30–60 days are setup and validation, not production.
Pro Tip: Before scoping any tool, map every reporting task your team does in a close cycle and tag each one as rule-based or judgment-based. Only rule-based tasks belong in an automation pilot. Judgment-based tasks belong in a workflow that routes exceptions to a human reviewer.
How does an automated reporting system actually work?
The architecture follows a consistent pattern: source-system connectors pull raw data into a staging layer, a transformation and rules engine validates and maps it, a consolidation layer applies eliminations and roll-ups, and a reporting layer generates formatted outputs with a full audit trail attached at every step.
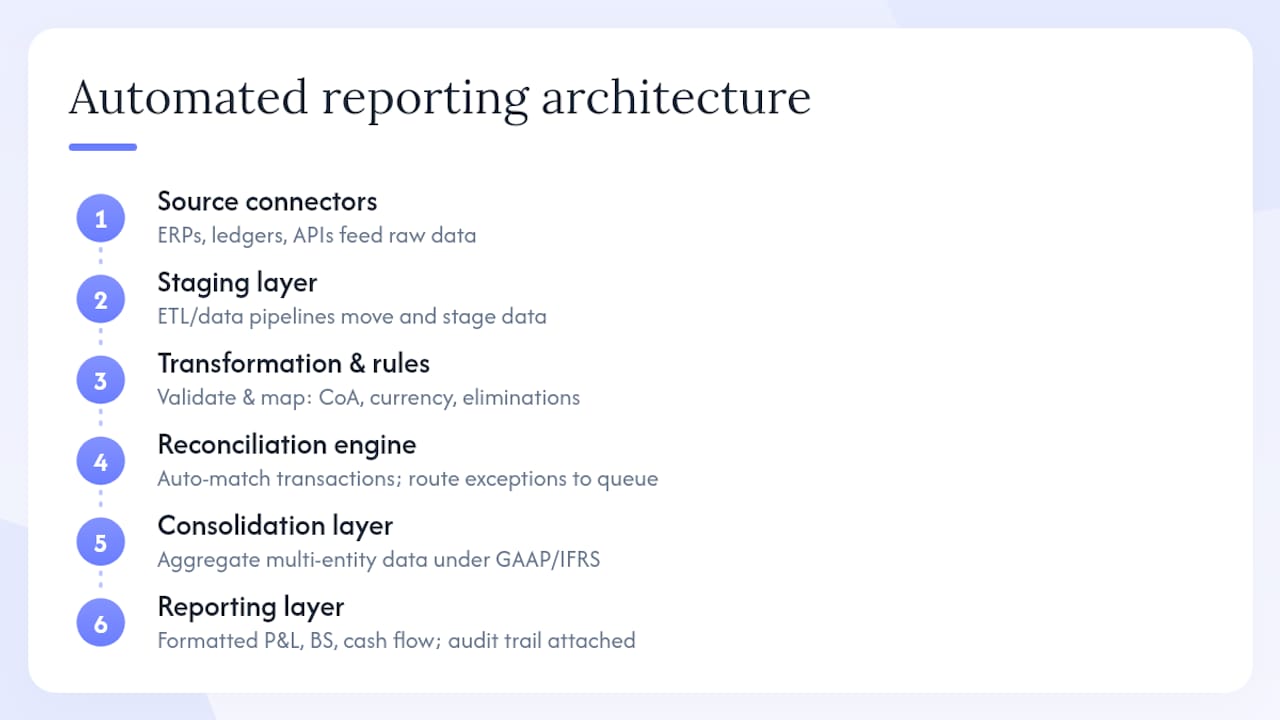
Each component carries specific responsibilities. Connectors and APIs link your ERPs (SAP, Oracle, NetSuite, Workday), general ledgers, and sub-ledgers to the automation platform. ETL/data pipelines move and stage that data without manual export/import cycles. A mapping and rules engine applies your chart-of-accounts logic, currency conversions, and intercompany elimination rules. A reconciliation engine auto-matches transactions and routes unmatched items to exception queues. The consolidation layer aggregates multi-entity data under GAAP or IFRS rules. Reporting templates generate formatted P&L, balance sheet, cash flow, and disclosure documents. A workflow/orchestration layer manages approvals, notifications, and scheduling. And the audit trail logs every transformation, rule applied, and user action, which is what makes the output defensible to auditors.
Genpact’s record-to-report suite adds a layer on top of this: agentic AI that uses continuous learning to automate journal entry, reconciliation, and intercompany workflows, with dynamic anomaly detection and confidence-driven governance that flags low-confidence outputs for human review rather than passing them through silently.
KPMG’s Financial Reporting Harmony platform illustrates a different architectural pattern: live linking across Excel, Word, and PowerPoint so that when a source figure changes, every downstream document updates automatically, with version control and audit trail built in. That live-flow architecture reduces the turnaround time for input changes and supports concurrent editing across remote teams.
Pro Tip: Keep transaction-level automation (ingestion, matching, consolidation) architecturally separate from your narrative-generation layer (LLMs writing commentary). They have different error modes, different governance requirements, and different rollback costs if something goes wrong.
Which parts of financial reporting should you automate first?
Prioritize by two axes: volume of manual effort and clarity of the rule. The highest-impact, lowest-complexity candidates come first.
-
Trial balance ingestion and chart-of-accounts mapping. High volume, fully rule-based, and the foundation everything else depends on. Automating this first gives you a clean data layer for every downstream process.
-
Account reconciliations. Auto-matching on transaction ID, amount, and date handles the majority of items in most ledgers. Exceptions route to a queue for human review. For a mid-size company with thousands of monthly reconciliations, this is often where the largest time savings appear.
-
Intercompany eliminations. Rule-based once your intercompany matrix is documented. Automation applies the eliminations consistently every period, removing a common source of consolidation errors.
-
Month-end management packs. Once the trial balance and reconciliations are clean, one-click P&L, balance sheet, and cash flow generation becomes straightforward. Finance-native platforms like those described by Abacum offer live reports and one-click roll-forwards that reduce repeated manual reconciliation between planning and actuals.
-
Disclosure templates and regulatory filing drafts. Higher complexity, but high value once the upstream data is reliable. Automate the data population; keep human review on the narrative and judgment sections.
For small and mid-size organizations, start with items 1 and 2. A single-entity company with a clean ERP can often automate trial balance ingestion and reconciliation in under 60 days with a focused custom build. For multi-entity enterprises, items 3 and 4 are the bigger prizes, but they require a documented intercompany matrix and a consolidation rules library before automation adds value.
What are the real benefits, and how do you calculate ROI?
The core value proposition is straightforward: automation shifts your team’s time from assembling data to analyzing it. HighRadius product materials cite outcomes including up to a 30% reduction in days to close and material improvements in consolidation accuracy for multi-entity reporting environments.
Measurable benefit levers:
- Close cycle reduction. Fewer manual handoffs mean fewer delays. Teams that automate reconciliation and consolidation typically compress their close by days, not hours.
- FTE reallocation. Hours previously spent on data assembly shift to variance analysis, forecasting, and business partnering.
- Error reduction. Rules-based processing eliminates transcription errors and formula mistakes that accumulate in spreadsheet-driven workflows.
- Audit readiness. A complete audit trail generated automatically reduces the hours your team spends pulling documentation during audit season.
- Faster approvals. Bill highlights faster approvals and greater transparency as consistent outcomes of well-governed automation projects.
Sample ROI calculation template:
Fill in your own numbers. A finance team spending 200 hours per month on manual data assembly at a $75 loaded hourly rate is carrying $180,000 per year in labor cost for work that automation can handle.
Statistic callout: HighRadius cites up to a 30% reduction in days to close as a representative outcome for automated financial statement workflows in multi-entity environments.
What risks should you prepare for before you start?
The single biggest operational risk is this: automation does not fix bad data, it accelerates it. If your chart-of-accounts mapping is inconsistent or your ERP has duplicate entries, an automated pipeline will produce wrong reports faster than your team could produce them manually.
| Risk | Practical Mitigation |
|---|---|
| Poor data quality in source systems | Audit and clean source data before connecting; establish a data quality threshold as a go/no-go criterion |
| Weak controls on automated outputs | Implement role-based access, approval workflows, and exception routing before go-live |
| Versioning errors in linked documents | Use platforms with built-in version control and audit logs (Workiva and KPMG Harmony both provide this) |
| Over-reliance on poorly tuned AI models | Require confidence scoring and human-in-the-loop review for any AI-generated narrative or anomaly flag |
| Change management failure | Involve finance team members in pilot design; document the new workflow before automating it |
| SOX control gaps | Map automated controls to your existing SOX control framework before deployment; get audit sign-off on the control design |
Pro Tip: Invest in data governance before you invest in automation tooling. A data governance sprint of two to four weeks, documenting your single source of truth for each financial data element, will save you months of rework after deployment.
What features should you evaluate in an automation platform?
The must-have capabilities are non-negotiable for any U.S. finance team operating under GAAP with SOX obligations or SEC reporting requirements.
Must-have features:
- Pre-built connectors to your ERP (SAP, Oracle, NetSuite, Workday, Microsoft Dynamics)
- Reconciliation engine with auto-matching and configurable exception routing
- Rules-based consolidation with intercompany elimination support
- Full audit trail with timestamped, user-attributed logs for every transformation
- Role-based access control (RBAC) with segregation of duties
- SOC 1 Type II and SOC 2 Type II certifications from the vendor
- SOX-ready control documentation and evidence export
- Data lineage tracking from source to output
Nice-to-have features:
- AI-generated narrative commentary with confidence scoring
- Live linking across document types (Excel, Word, PowerPoint)
- Built-in project management and workflow orchestration
- Self-serve report roll-forward (one-click period updates)
- Natural language query interface for ad hoc analysis
Workiva’s platform specifically addresses ERP connectors (including HFM, SAP, and Workday), link-based updates, audit logs, and controlled collaboration for SEC and SOX-ready reporting. The AICPA’s SOC guidance is the standard framework for assessing a vendor’s control environment; request the vendor’s SOC report as part of any evaluation.
For GAAP vs. IFRS: confirm the platform’s consolidation rules engine supports your specific standard, including treatment of minority interests, foreign currency translation, and segment reporting. U.S. companies filing with the SEC under GAAP need explicit confirmation that the platform’s output formats meet EDGAR requirements.
How do you run a low-risk 30–60 day pilot?
A well-scoped pilot answers one question: can this system ingest our data, apply our rules, and produce a reconciled output that matches what our team produces manually? Keep the scope narrow enough to answer that question cleanly.
30–60 day pilot summary:
- Scope: One entity, one reporting period, one process (trial balance ingestion + account reconciliation)
- Success criteria: Output matches manual result within agreed tolerance; audit trail is complete; exceptions are correctly routed; team can operate the workflow without vendor support
- Go/no-go decision: At day 45, review against criteria. Scale if criteria are met; extend or re-scope if not.
Sample weekly timeline:
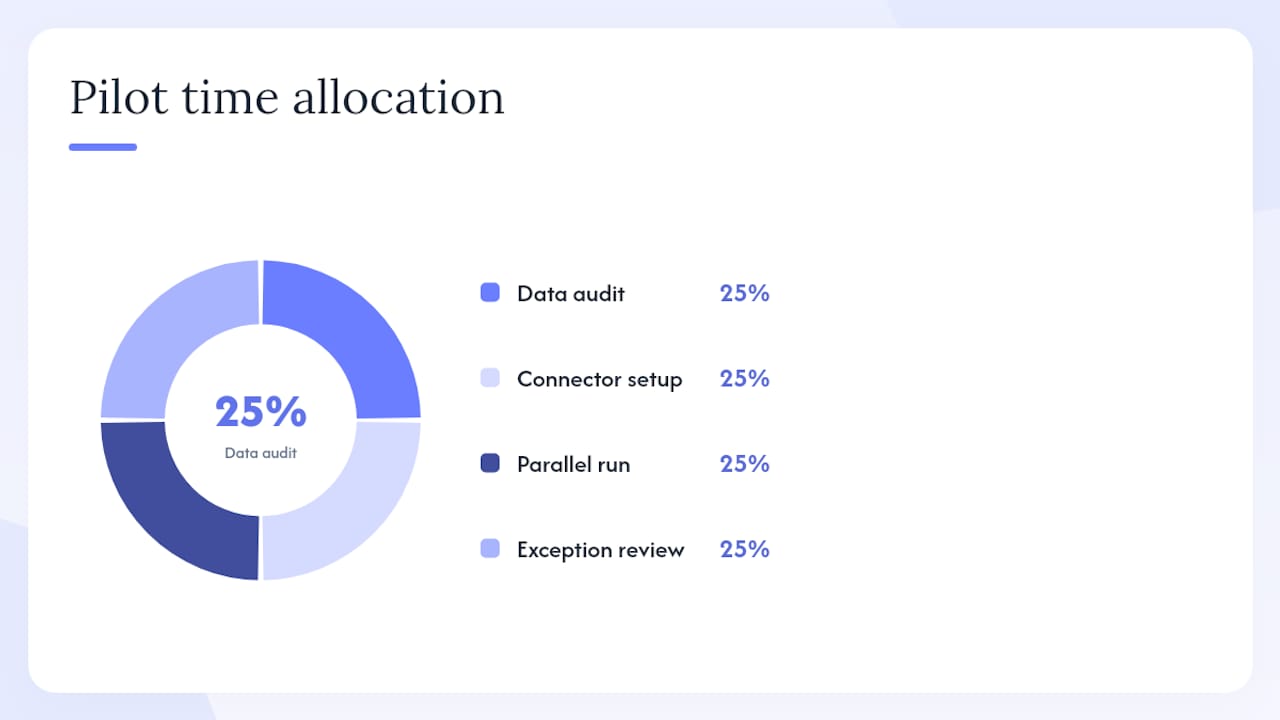
- Weeks 1–2: Data audit and source-system mapping. Finance lead and data steward document the chart of accounts, identify data quality issues, and confirm ERP connector configuration with IT.
- Weeks 3–4: Connector setup, ETL configuration, and rules engine build. Vendor/partner configures the pipeline; finance lead validates mapping against manual workpapers.
- Weeks 5–6: Parallel run. Automated output runs alongside the manual process for one full close cycle. Finance lead compares results line by line.
- Weeks 7–8: Exception review, reconciliation of variances, and audit trail review. Data steward and project manager document findings. Go/no-go decision at end of week 8.
Roles and responsibilities:
| Role | Responsibility |
|---|---|
| Finance lead (controller or FP&A manager) | Owns success criteria, validates output, signs off on go/no-go |
| IT/infrastructure | Configures ERP connectors, manages credentials and access |
| Data steward | Owns data quality audit, documents mapping rules |
| Project manager | Tracks milestones, manages vendor/partner communication |
| Vendor/partner | Configures platform, resolves technical issues, provides training |
Pilot acceptance checklist:
- Automated output matches manual result within defined tolerance (e.g., zero material variances)
- All exceptions are correctly identified and routed to the right reviewer
- Audit trail is complete and exportable
- Role-based access is configured and tested
- Finance team can run the workflow independently
Pro Tip: Run your pilot on ingestion and reconciliation only. Do not add AI-generated narrative commentary until the data layer is proven clean. Adding an LLM on top of a dirty data pipeline produces confident-sounding wrong answers, which is worse than no commentary at all.
Which KPIs prove that automation is working?
Track three categories: process efficiency, data quality, and business impact. Without all three, you cannot distinguish a successful deployment from a system that is fast but producing unreliable output.
Process KPIs:
- Close cycle time (days from period end to report delivery, tracked period over period)
- Percent touchless reconciliations (reconciliations completed without human intervention)
- Exceptions per period (volume and trend; declining exceptions signal improving data quality)
- Report generation time (hours from data availability to formatted output)
Quality KPIs:
- Error rate in automated outputs (variances vs. manual benchmark during parallel run, then vs. prior period)
- Audit trail completeness (percent of transformations with full lineage documentation)
- Restatement or correction frequency (should decline as automation matures)
Business impact KPIs:
- Analyst hours reallocated to value-added work (track via time logging or manager estimate)
- Audit preparation hours saved per audit cycle
- Stakeholder satisfaction with report timeliness and accuracy (simple quarterly survey)
Share a dashboard of these KPIs with your CFO and audit committee quarterly. The close cycle time trend and percent touchless reconciliations are the two numbers that most clearly communicate automation’s operational value to non-technical stakeholders.
A real-world example: from hours to minutes
The most instructive case study is not a Fortune 500 deployment. It is a small-to-mid-size organization that rebuilt its reporting infrastructure from scratch and measured the outcome in hours saved per close cycle.
The pattern in that engagement follows a recognizable architecture. The client’s source data lived in a combination of ERP exports and spreadsheets. The problem was not the data itself but the manual assembly process: pulling exports, mapping accounts, reconciling intercompany balances, and formatting management packs consumed most of the close cycle. The solution replaced that manual assembly with a custom pipeline: ERP → staging layer → mapping/rules engine → consolidation → formatted reporting outputs. The audit trail was built into the pipeline from day one, not added as an afterthought.
HighRadius documents similar outcomes at scale, citing up to a 30% reduction in days to close for multi-entity environments with automated consolidation and reconciliation. The mechanism is consistent across implementations: removing manual handoffs between systems compresses the close, and auto-matching on reconciliations eliminates the back-and-forth that typically extends the cycle.
For a small business, the architecture does not need to be enterprise-grade. A custom-built pipeline connecting QuickBooks or NetSuite to a reporting layer, with a rules engine that applies your specific chart-of-accounts mapping, can deliver the same time compression at a fraction of the cost of an enterprise platform license.
What questions should you ask every vendor?
Go into every vendor call with a written list. Vendors who cannot answer these questions directly are telling you something important about their product’s maturity.
Mandatory questions:
- Which ERP connectors do you support natively, and what is the setup time for our specific ERP version?
- Describe your audit trail: what is logged, at what granularity, and how is it exported for auditors?
- Are you SOC 1 Type II and SOC 2 Type II certified? Can you provide the most recent report?
- How do you handle intercompany eliminations for multi-entity consolidations?
- What are your SLA commitments for uptime and support response during close periods?
- Where does our data reside, and how do you handle data residency requirements for U.S. entities?
- Can you provide a reference client in our industry with a similar ERP environment?
Evaluation scoring approach:
- Fit-for-purpose (score 1–5): Does the platform handle your specific processes (reconciliation, consolidation, disclosure) without significant customization?
- Scale readiness (score 1–5): Can it grow with your entity count, transaction volume, and reporting complexity?
- Control environment (score 1–5): Does the vendor’s SOC report and audit trail design meet your SOX and audit requirements?
- Integration posture (score 1–5): How clean is the connector to your ERP, and what is the data latency?
Red flags that should halt procurement:
- Vendor cannot produce a SOC 2 Type II report on request
- Audit trail is not exportable in a format your auditors can review independently
- No reference clients in your industry or with your ERP
- Pricing structure requires a multi-year lock-in before you have completed a pilot
- Vendor cannot demonstrate intercompany elimination logic in a live demo
What should your 30, 60, 90 day plan look like?
This is not a roadmap. It is a decision framework with explicit go/no-go gates.
-
Day 30 checkpoint: Data audit complete, source-system connectors configured, pilot scope confirmed. Go/no-go: Is the source data clean enough to proceed? If data quality issues are material, pause and remediate before continuing. The person who signs off: your controller or CFO.
-
Day 60 checkpoint: Parallel run complete, automated output validated against manual workpapers, exceptions reviewed. Go/no-go: Does automated output match manual result within tolerance? Is the audit trail complete? If yes, proceed to scale planning. If no, identify root cause (data quality, rules configuration, or connector issue) and re-run.
-
Day 90 checkpoint: Scale decision. If the pilot passed at day 60, day 90 is for scoping the next process to automate (intercompany eliminations or management pack generation) and confirming the vendor/partner contract for production deployment. If the pilot did not pass, evaluate whether a second, narrower pilot on a cleaner data set is warranted, or whether the platform is not the right fit.
Stakeholder adoption, measured by whether the finance team trusts and uses the automated output without reverting to manual checks, is the most honest signal of whether the deployment is actually working.
What I’ve seen work for small and mid-size finance teams
The conventional wisdom says buy a platform, configure it, and automate everything. That advice works well for large enterprises with dedicated IT teams and standardized ERPs. For small and mid-size finance teams, it often leads to over-engineered deployments that sit unused because the configuration burden exceeds the team’s capacity to maintain it.
What actually works at smaller scale is targeted custom automation: a pipeline built specifically for your ERP, your chart of accounts, and your reporting structure, without the overhead of a platform license for features you will never use. A custom-built reconciliation and reporting pipeline can be scoped, built, and validated in 60 days. It does not require a six-month implementation project or a dedicated platform administrator.
The trade-off is real: custom builds require a capable development partner and ongoing maintenance, while off-the-shelf platforms offer more self-service features and vendor support. For a single-entity company with a clean ERP and a straightforward reporting structure, custom automation often delivers faster time-to-value and lower total cost. For a multi-entity enterprise with complex consolidation requirements, a purpose-built platform is usually the right call.
Where to invest first if you are a small business: automate trial balance ingestion and account reconciliation before anything else. Those two processes account for the majority of manual close-cycle labor in most small finance teams, and they are the cleanest candidates for rule-based automation.
Ctrlaltorion builds the reporting automation your team will actually use
Most small finance teams do not need an enterprise platform with a six-figure license fee. They need a clean pipeline from their ERP to a formatted report, built around their specific chart of accounts and close process, delivered in weeks rather than months.
Ctrlaltorion builds exactly that: custom reporting automations, dashboards, and data integrations for small businesses and growing finance teams. The engagement starts with a scoped discovery call where we map your current close process, identify the highest-impact automation candidates, and define a pilot scope with clear acceptance criteria. From there, we build and validate the pipeline in a 30–60 day sprint, with your finance lead involved at every checkpoint. No long-term lock-in before you have seen the output. No platform license for features you do not need.
If your team is spending more than a day per close cycle on manual data assembly, that is the problem we solve. Ctrlaltorion and we will scope a pilot that fits your timeline and budget.
Sources
4 refs- What is Financial Reporting Automation? | IBMibm.com
- KPMG Financial Reporting Harmonykpmg.com
- Genpact Record-to-Report Suitegenpact.com
- Billbill.com
comments
loading comments…
No comments yet. Start the thread.