
Diagnose the bottleneck first, apply low-risk quick wins (caching, CDNs, read replicas), then evolve the architecture (stateless services, autoscaling, sharding) only as traffic signals demand it. That sequence matters more than any individual tool. Scaling follows stages: the architecture that serves 100 users should look nothing like the one serving a million, and teams that skip straight to Kubernetes clusters and distributed databases pay a steep coordination tax for complexity they don’t yet need.
Here’s the immediate action list for a system under pressure right now:
- Measure first. Pull p95/p99 latency, error rate, CPU, memory, DB connection pool saturation, and I/O wait. You can’t fix what you haven’t located.
- Add a CDN. Put Cloudflare in front of static assets and cacheable API responses. This is the fastest latency win with the lowest rollback cost.
- Cache hot reads. Stand up Redis and cache expensive query results, session data, and computed aggregates. A well-designed cache can absorb a very large portion of the read load for many workloads.
- Add a read replica. PostgreSQL read replicas on AWS RDS or DigitalOcean Managed Databases offload SELECT traffic from your primary within hours.
- Externalize session state. Move sessions out of app memory into Redis or a token-based auth scheme (JWT) before you add a second app instance.
- Containerize and autoscale. Once the app is stateless, deploy on Kubernetes or AWS Auto Scaling groups and let the platform handle capacity.
Stop applying quick fixes and move to architectural changes when you see sustained p99 latency above your SLO, connection pool saturation that caching doesn’t relieve, or monthly infrastructure cost growing faster than revenue.
Pro Tip: Before touching production, shadow real traffic to a staging environment using a tool like AWS Traffic Mirroring or a feature-flagged canary. You’ll catch regressions without blast radius.
Key Takeaways
Scaling a web app reliably requires measuring the actual bottleneck first, applying caching and read replicas as early wins, then evolving architecture (stateless services, autoscaling, sharding) only as traffic signals justify the added complexity.
| Point | Details |
|---|---|
| Measure before you build | Collect p95/p99 latency, DB connection saturation, and error rate before adding any infrastructure. |
| Caching is the fastest win | Redis and Cloudflare CDN can absorb 80–90% of read load, reducing origin pressure immediately. |
| Database scales in stages | Add indexes and read replicas before sharding; PgBouncer is required once you run multiple app instances. |
| Autoscale conservatively | Scale out fast, scale in slow; one extra idle instance is cheaper than a 503 storm during a traffic rebound. |
| Ctrlaltorion accelerates this | Project-based engagements cover architecture audits, DB migrations, and CI/CD setup with no long-term lock-in. |
Table of Contents
- What does scaling a web app actually mean?
- How do you find the real bottleneck before scaling?
- Which architecture changes actually improve scalability?
- How do you scale the database without breaking everything?
- How do caching and CDNs reduce load on your origin?
- How do load balancers and autoscaling work together?
- When should you use async processing instead of synchronous calls?
- What observability do you need to catch scale issues early?
- How does CI/CD enable safe scaling operations?
- What does scaling actually cost, and how do you phase it?
- When should you hire a custom development partner?
- What most teams get wrong about scaling
- Ctrlaltorion builds the scaling infrastructure you need
- What Ctrlaltorion offers teams ready to scale
- Sources
What does scaling a web app actually mean?
Scaling a web application means increasing its capacity to handle more users, requests, or data without degrading performance or reliability. The industry uses three models, and picking the wrong one for your stage is expensive.
Vertical scaling (scale up) means upgrading the machine: more CPU cores, more RAM, a faster disk. It’s operationally simple, requires zero code changes, and is the right first move for most teams. The ceiling is real, though. At some point, no single machine is large enough, and a hardware failure takes the whole system down.
Horizontal scaling (scale out) means adding more machines and distributing load across them. It gives you redundancy and, in theory, unlimited capacity. The trade-off is coordination overhead: you need a load balancer, stateless app servers, and an external session store. Code that assumes a single process breaks in ways that are genuinely painful to debug.
Diagonal scaling combines both: scale up until you hit the hardware ceiling, then scale out. Most teams end up here, using a hybrid approach because vertical scaling is simpler initially and horizontal scaling handles elastic traffic patterns. The practical rule is to prefer vertical until you hit hardware ceilings or need fault tolerance, then layer in horizontal capacity.
| Attribute | Vertical | Horizontal |
|---|---|---|
| Growth ceiling | Hard hardware limit | Effectively unlimited |
| Failure behavior | Single point of failure | Redundant; one node down doesn’t kill the app |
| Code changes required | None | Stateless design, external session store |
| Best for | Legacy apps, strong consistency, short-term relief | Elastic traffic, fault tolerance, cloud-native workloads |
| Cost profile | Predictable; one large instance | Variable; pay per active node |
The decision isn’t permanent. Start vertical, instrument everything, and let the metrics tell you when horizontal capacity is worth the complexity.
How do you find the real bottleneck before scaling?
The most common scaling mistake is adding capacity to the wrong layer. Teams spin up extra app servers while a slow SQL query is the actual culprit. Measure before you build.
Core metrics to collect
- Request latency: p95 and p99, not averages. Averages hide the tail behavior that users actually experience.
- Error rate: 5xx responses as a percentage of total requests, broken out by endpoint.
- CPU and memory: both app servers and database nodes.
- DB connection pool saturation: if your pool is maxed, adding app instances makes it worse.
- I/O wait: high I/O wait on the DB node points to disk-bound queries or missing indexes.
- Queue lengths: for async workers, a growing queue means workers can’t keep up.
Profiling and tracing
Instrument your app with OpenTelemetry and route traces to Jaeger, Tempo, or AWS X-Ray. Flamegraphs from a profiler (py-spy for Python, async-profiler for JVM, pprof for Go) show you exactly which function is eating CPU. For databases, run EXPLAIN ANALYZE on slow queries in PostgreSQL and look for sequential scans on large tables.
Load-testing checklist
- Define a realistic traffic shape: concurrent users, requests per second, and the ratio of reads to writes.
- Run a soak test (sustained load for 30–60 minutes) to catch memory leaks and connection pool exhaustion.
- Run a spike test (sudden 10x traffic burst) to validate autoscaling warm-up time.
- Run a stress test (ramp until the system breaks) to find the actual ceiling.
- Compare results against your SLOs before and after each change.
Pro Tip: Use traffic shadowing or a canary deployment to replay production traffic against a new configuration. You get realistic load patterns without exposing users to an untested change.
Which architecture changes actually improve scalability?
Architecture is where teams either buy themselves years of headroom or create a distributed monolith that’s harder to operate than what they started with. The goal is to externalize state, enforce clear API boundaries, and decompose only when the coordination cost is worth it.
Core principles
- Stateless app servers. Every request must be completable by any instance. Sessions, file uploads, and computed state belong in Redis, S3, or a database, not in process memory.
- Single responsibility. Each service or module should own one domain. Blurry ownership creates coupling that defeats the purpose of decomposition.
- Idempotency. Design write operations so retrying them produces the same result. This is non-negotiable for distributed systems where at-least-once delivery is the norm.
- Graceful degradation. When a downstream service is slow, return a cached or partial response rather than propagating the failure upstream.
Monolith vs. microservices: the honest trade-off
Application scalability depends on modular design and externalized state, but that doesn’t mean you need microservices on day one. A well-structured monolith with clear module boundaries, a separate database, and stateless servers handles a surprising amount of traffic.
The distributed-monolith trap is real: teams split a monolith along arbitrary lines, end up with synchronous HTTP calls between every service, and gain none of the fault-isolation benefits while paying the full operational cost.
The rule worth printing out: decompose along domain boundaries, not technical layers. Splitting “frontend service” from “backend service” is a technical split that creates tight coupling. Splitting “order management” from “user profiles” is a domain split that enables independent scaling and deployment.
Kubernetes and containerization
Containerizing your app with Docker and deploying on Kubernetes gives you portable, reproducible deployments and access to primitives like Horizontal Pod Autoscaler (HPA), service discovery, and rolling updates. For teams not ready for Kubernetes, AWS Elastic Beanstalk or DigitalOcean App Platform offer managed horizontal scaling with less operational overhead. Build in layers: clean API boundaries and sensible DB design first; add Kubernetes orchestration only after signals justify the operational investment.
Pro Tip: Design your SaaS workflows for scale from the start by treating each domain as an independently deployable unit, even inside a monolith. The module boundaries you draw today become the service boundaries you cut along later.
How do you scale the database without breaking everything?
The database is almost always the first real bottleneck, and the fix sequence matters. Jump straight to sharding when you actually need read replicas and you’ll spend months on a migration that buys you nothing.
Quick wins (apply these first)
- Add indexes. Run
pg_stat_user_tablesandpg_stat_user_indexesin PostgreSQL to find sequential scans and unused indexes. A missing index on a foreign key column is a common culprit. - Profile slow queries. Enable
pg_stat_statementsand sort by total execution time. Fix the top five queries before adding hardware. - Add a read replica. PostgreSQL streaming replication on AWS RDS or DigitalOcean Managed Databases routes SELECT traffic away from the primary. Separating the database and adding read replicas are the two highest-leverage steps before any architectural overhaul.
- Cache expensive queries. Store computed results in Redis with a sensible TTL. Hot-path queries that run thousands of times per minute are the best candidates.
Connection pooling
When you run many stateless app instances, each one opens its own database connections. At scale, this exhausts the DB’s connection limit fast. A connection proxy like PgBouncer (for PostgreSQL) or ProxySQL (for MySQL) multiplexes hundreds of client connections into a small pool of actual server connections. This is not optional at scale; it’s a prerequisite for horizontal app scaling.
When to shard
Try vertical scaling and right-sizing the database instance before sharding. Modern large instances (AWS db.r6g.16xlarge, for example) handle substantial traffic and postpone sharding complexity considerably. Shard when you see sustained disk I/O saturation, single-node CPU or RAM maxed out despite query optimization, or cross-tenant hot partitions that can’t be resolved by read replicas.
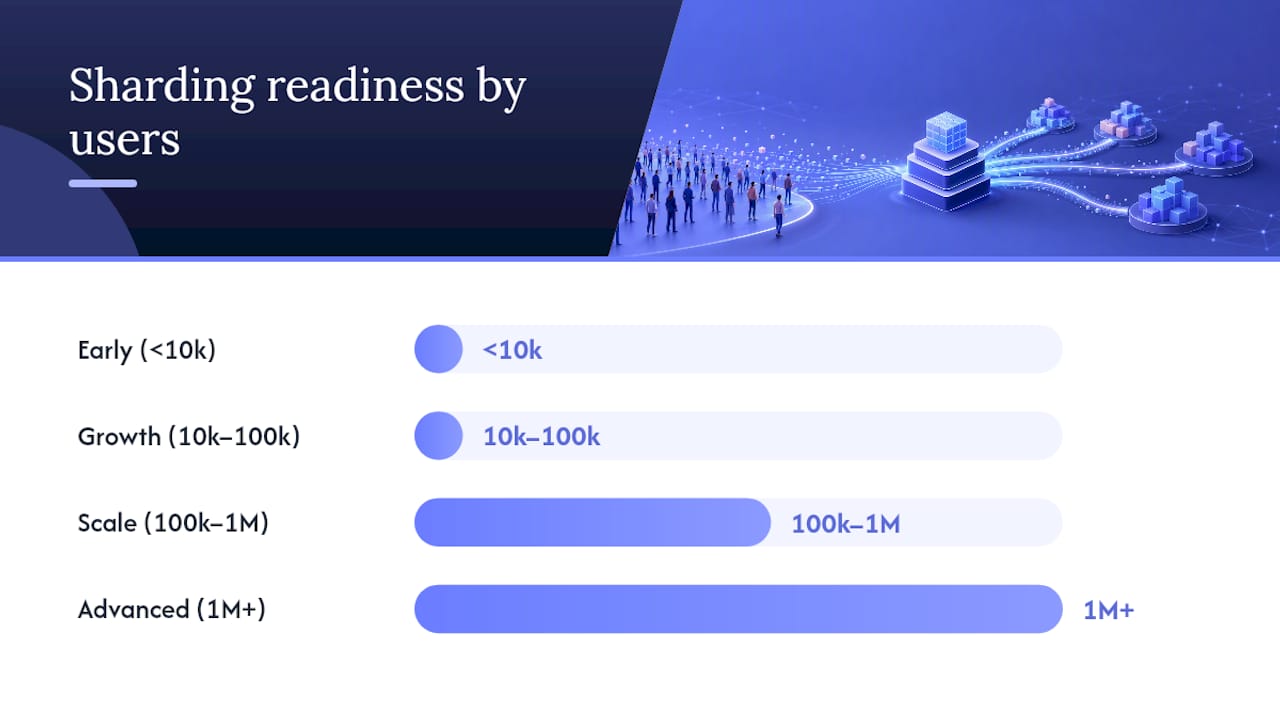
When you do shard, split data by function first (orders, user profiles, analytics into separate databases) before sharding by key. Application routing must know which database holds which data to avoid cross-shard queries.
| Stage | Signal | Action |
|---|---|---|
| Early (< 10k users) | Slow queries, no indexes | Index, query tune, separate DB from app server |
| Growth (10k–100k) | Read-heavy load, replica lag | Add read replicas, PgBouncer, Redis cache |
| Scale (100k–1M) | Primary CPU/RAM maxed | Vertical scale DB, add connection pooling |
| Advanced (1M+) | Disk I/O saturated, hot partitions | Functional splits, then key-based sharding |
- Identify the highest-traffic tables and their access patterns.
- Add indexes and fix the top slow queries.
- Deploy PgBouncer in front of PostgreSQL.
- Add a read replica and route read traffic to it.
- Evaluate functional database splits before committing to sharding.
- Plan shard migration with dual-write and backfill, not a big-bang cutover.
How do caching and CDNs reduce load on your origin?
Caching is the highest-leverage, lowest-risk scaling lever available.
Cache layers to add
- CDN (Cloudflare). Cache static assets (JS, CSS, images) and cacheable API responses at the edge, close to users. Cloudflare’s global network reduces latency for geographically distributed users and absorbs DDoS traffic before it reaches your origin.
- Reverse proxy cache (Nginx, Varnish). Cache full HTTP responses at the server layer for public, non-personalized content.
- Application cache (Redis/Memcached). Store computed results, session data, and hot database rows in memory. Redis is the default choice: it supports rich data structures, pub/sub, and atomic operations.
- Browser cache. Set
Cache-Controlheaders correctly. Amax-age=31536000on versioned static assets means users never re-download them.
Caching patterns
Cache-aside is the most common pattern: the application checks the cache, fetches from the database on a miss, and writes the result back. It’s flexible but puts cache-population logic in application code.
Read-through delegates cache population to the cache layer itself. Simpler application code, but less control over what gets cached.
Write-through writes to the cache and the database simultaneously on every write. Keeps the cache fresh but adds write latency.
Use write-through for data that’s read far more than it’s written (user profiles, product catalogs). Use cache-aside for data with complex invalidation logic.
Cache invalidation
Cache invalidation is the hardest part of caching. Design explicit invalidation triggers: when a record is updated, delete or update its cache key immediately. Use short TTLs (60–300 seconds) for data where eventual consistency is acceptable. For data that must be fresh (inventory counts, financial balances), skip the cache or use a write-through pattern with immediate invalidation.
Pro Tip: Tag cache keys by entity type (e.g., user:42:profile) so you can invalidate all keys for a given entity in one operation. Flat key naming makes bulk invalidation nearly impossible.
How do load balancers and autoscaling work together?
A load balancer distributes incoming traffic across your app instances. Autoscaling adjusts the number of instances based on demand. Together, they’re the mechanism that makes horizontal scaling practical.
Load balancer types
Layer 4 (TCP/UDP) load balancers route traffic based on IP and port. They’re fast and protocol-agnostic but can’t inspect HTTP headers or route based on URL paths.
Layer 7 (HTTP/HTTPS) load balancers route based on request content: URL path, headers, cookies, or query parameters. AWS Application Load Balancer (ALB) and Cloudflare’s load balancing operate at L7. Use L7 for web apps; it gives you path-based routing, header injection, and SSL termination.
Routing strategies
- Round-robin: distribute requests evenly across instances. Works well when requests are roughly uniform in cost.
- Least-connections: send new requests to the instance with the fewest active connections. Better for workloads with variable request duration.
- Consistent hash (sticky sessions): route requests from the same client to the same instance. Use this only when you can’t externalize session state, and plan to migrate off it.
Autoscaling policies
- Set a scale-out trigger: CPU > 70% for 2 minutes, or request rate per instance exceeds a threshold.
- Set a scale-in trigger conservatively: CPU < 30% for 10 minutes. Be slow to remove capacity.
- Set a minimum instance count that handles your baseline traffic without autoscaling.
- Set a warm-up period so new instances pass health checks before receiving traffic.
- For Kubernetes, configure HPA on request rate or custom metrics via KEDA for event-driven workloads (e.g., queue depth).
Autoscaling should be conservative on scale-in. Removing capacity too aggressively causes user-facing errors when traffic rebounds. Keeping one extra instance is cheaper than a 503 storm.
Session management at scale
Sticky sessions are a band-aid. The real fix is to externalize session state to Redis and use token-based auth (JWT or OAuth tokens) so any instance can serve any request. This is a prerequisite for reliable horizontal scaling and makes blue/green deployments safe.
When should you use async processing instead of synchronous calls?
Synchronous request handling works until it doesn’t. When a user action triggers a long-running job (image resizing, PDF generation, email dispatch, ETL), blocking the HTTP response on that job kills your p99 latency and ties up app server threads.
When to go async
- Long-running jobs (> 500ms) that don’t need an immediate result.
- Retryable tasks where at-least-once delivery is acceptable.
- Workflows with eventual consistency (order confirmation emails, analytics events).
- Batch operations that can be deferred to off-peak hours.
Queue and broker options
- AWS SQS: managed, serverless, integrates natively with Lambda and ECS. Best for simple task queues with no ordering requirements.
- Kafka: high-throughput event streaming with durable log storage. Use it when you need event replay, fan-out to multiple consumers, or strict ordering within a partition.
- RabbitMQ: flexible routing with exchanges and bindings. Good for complex routing topologies.
- Redis Streams: lightweight, in-memory streams with consumer groups. A practical choice when Redis is already in your stack and throughput requirements are moderate.
Worker design
- Size worker pools based on the slowest downstream dependency, not CPU.
- Implement dead-letter queues for messages that fail repeatedly. Alert on DLQ depth.
- Make every job idempotent: processing the same message twice must produce the same result.
- Set visibility timeouts longer than your job’s worst-case runtime to prevent duplicate processing.
- Implement backpressure: if the queue grows faster than workers can drain it, add workers or shed load rather than letting the queue grow unbounded.
Pro Tip: For image processing, notifications, and ETL jobs, use a separate worker pool per job type. Mixing fast notification jobs with slow ETL jobs in one pool means a batch job backlog delays user-facing notifications.
What observability do you need to catch scale issues early?
You can’t scale what you can’t see. Observability isn’t a nice-to-have; it’s the feedback loop that tells you whether a scaling change worked or made things worse.
Essential telemetry
- Metrics: request rate, p95/p99 latency, error rate, saturation (CPU, memory, connection pool), and queue depth. Export to Prometheus and visualize in Grafana.
- Distributed tracing: instrument with OpenTelemetry and route to Jaeger, Grafana Tempo, or AWS X-Ray. Traces show you which service in a call chain is adding latency.
- Structured logs: JSON-formatted logs with request IDs, user IDs, and trace IDs so you can correlate a slow trace with its log lines. Ship to a log aggregator (Loki, Datadog, CloudWatch).
- Resource metrics: node-level CPU, memory, disk I/O, and network throughput from the Prometheus node exporter or your cloud provider’s native monitoring.
SLO and alerting design
Set SLOs before you set alerts.
Load-testing strategy
- Establish a baseline with a low-concurrency run before any changes.
- Run a soak test at expected peak load for 30–60 minutes.
- Run a spike test to validate autoscaling response time.
- Run a stress test to find the breaking point.
- After each scaling change, re-run the baseline and compare p99 latency and error rate.
Tools: k6 for developer-friendly scripting, Gatling for JVM-based high-concurrency tests, Locust for Python-based distributed load generation.
A study of web performance patterns consistently shows that teams without structured load testing discover their scaling ceiling during a real traffic event, not before it.
How does CI/CD enable safe scaling operations?
Scaling changes are infrastructure changes. A shard migration, a new read replica, or a Kubernetes HPA configuration update can all cause outages if deployed carelessly. CI/CD pipelines make these changes repeatable and reversible.
Pipeline pattern
- Build: produce an immutable container image tagged with the commit SHA.
- Test: run unit, integration, and contract tests. Block on failure.
- Performance gate: run a short k6 smoke test against a staging environment. Fail the pipeline if p99 latency regresses by more than 20%.
- Canary deploy: route 5–10% of traffic to the new version. Monitor error rate and latency for 10–15 minutes.
- Progressive rollout: if canary metrics are clean, roll to 50%, then 100%.
- Automated rollback: if error rate exceeds the SLO threshold during rollout, roll back automatically.
Infrastructure as code
Manage every infrastructure change through Terraform, AWS CloudFormation, or Pulumi. Never apply manual changes to production. IaC gives you a diff-reviewable change history, reproducible environments, and a rollback path that’s a git revert away.
Rollout strategies for scaling operations
- Blue/green: run two identical environments; switch traffic at the load balancer. Zero-downtime deployments with instant rollback. Doubles infrastructure cost during the switch window.
- Canary: route a small percentage of traffic to the new version. Catches regressions with limited blast radius.
- Feature flags: decouple deployment from release. Deploy the new sharding logic behind a flag; enable it for 1% of users first.
Release checklist for scaling changes
- Schema migrations are backwards-compatible (add columns before removing old ones).
- API changes are versioned; old clients still work.
- Runbooks exist for every new infrastructure component.
- Rollback procedure is documented and tested.
Tools: GitHub Actions or GitLab CI for pipelines, ArgoCD or Flux for GitOps-based Kubernetes deployments, Terraform for IaC.
What does scaling actually cost, and how do you phase it?
Cost is the constraint that turns a good scaling plan into a realistic one. The three primary cost drivers are compute, data transfer and CDN fees, and managed database instances. Operational staff time is the fourth, and often the largest, for small teams.
Phased timeline
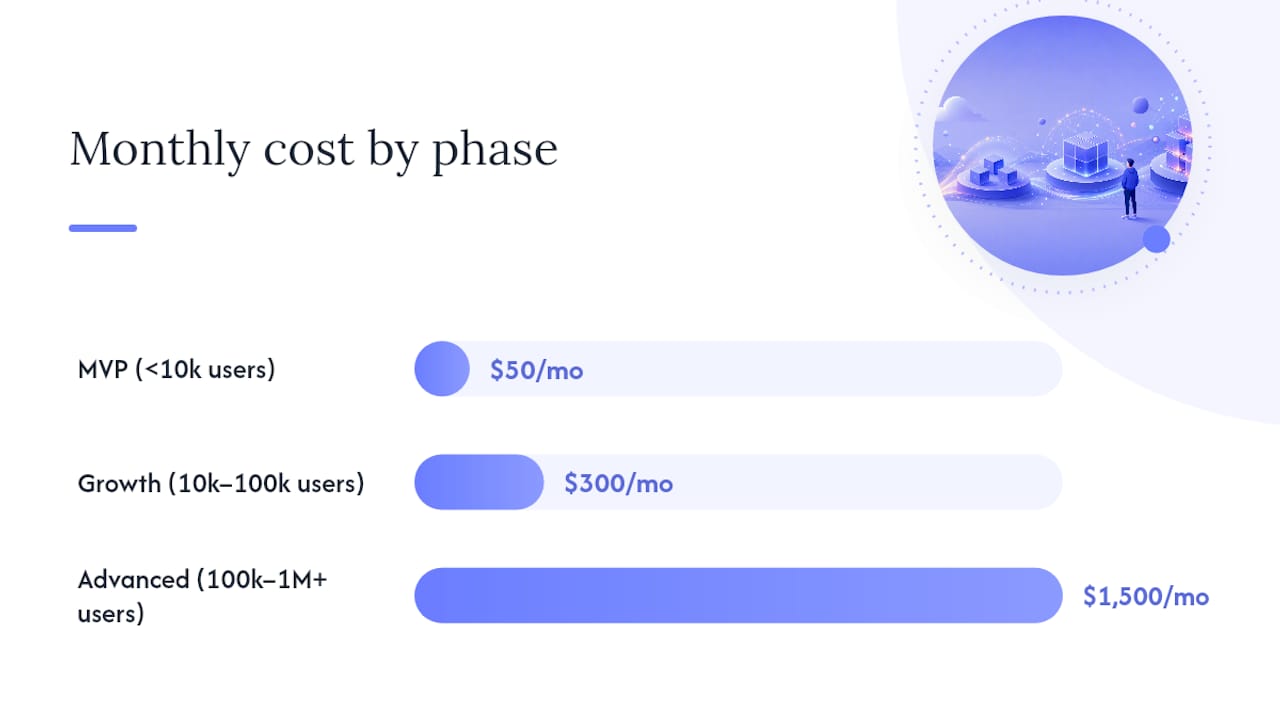
Phase 1: MVP (< 10k users). Right-size your instances. A $48/month DigitalOcean Droplet (4 vCPU, 8 GB RAM) handles more traffic than most early-stage apps need. Separate the database from the app server. Add basic monitoring.
Phase 2: Growth (10k–100k users). Add a read replica, deploy Redis for caching, put Cloudflare in front of your origin, and configure autoscaling. These quick wins buy significant headroom before any architectural overhaul is necessary.
Phase 3: Advanced (100k–1M+ users). Introduce connection pooling (PgBouncer), evaluate functional database splits, containerize on Kubernetes, add async job queues, and plan for multi-region if latency or availability requirements demand it.
| Phase | Representative setup | Approximate monthly cost range |
|---|---|---|
| MVP | 1 app server + 1 DB (DigitalOcean/AWS t3.medium) | $50 |
| Growth | 2–4 app servers + read replica + Redis + CDN | $300 |
| Advanced | Kubernetes cluster + managed DB + caching + CDN + monitoring | $1,500 |
Growing a SaaS without breaking systems requires balancing feature velocity with infrastructure stability at each phase. The teams that get this right treat each phase transition as a deliberate decision, not a reaction to an outage.
When should you hire a custom development partner?
Some scaling problems are straightforward enough to solve with documentation and a weekend. Others carry enough risk that the cost of getting it wrong exceeds the cost of outside help by a wide margin.
Signals you need an external partner
- Your team has strong product engineers but no one with production ops or database migration experience.
- You have a hard deadline (a product launch, a marketing event) and no runway to learn on the job.
- You’re facing a complex database migration (sharding, functional splits, zero-downtime schema changes) that your team hasn’t done before.
- Your infrastructure is a patchwork of manual changes with no IaC, and you need to stabilize it before scaling.
What a good engagement looks like
A structured engagement starts with a discovery and architecture audit: map the current system, identify the top three bottlenecks, and produce a prioritized backlog of quick wins and longer-term changes. Implementation follows in phases, with monitoring and handover built in so your team owns the system afterward.
Ctrlaltorion has delivered exactly this for small-business clients, including a reporting infrastructure overhaul that reduced processing time from hours to minutes. Engagements are structured as project-based or retainer contracts, sized to the scope of the work rather than a long-term lock-in.
What to expect
- A clear architecture audit with findings and a prioritized action list.
- Quick wins implemented first (caching, CDN, read replicas) to reduce immediate risk.
- Phased implementation with runbooks and documentation at each step.
- Monitoring and alerting configured before handover.
Pro Tip: Ask any prospective partner to walk you through a past database migration or scaling incident. The specifics of how they handled rollback, data consistency, and communication under pressure tell you more than a portfolio page.
What most teams get wrong about scaling
The most expensive scaling mistake isn’t under-scaling. It’s over-engineering too early. Teams that decompose a monolith into twelve microservices at 5,000 users spend the next year debugging distributed tracing and managing service mesh configuration instead of shipping features. The blast radius of premature complexity is real: it slows every subsequent change.
The second most common mistake is treating symptoms rather than causes. Adding app server instances to a system bottlenecked by a slow query is like adding lanes to a highway that ends in a traffic light. The queue just moves upstream. Measure first, always.
A few rules of thumb worth keeping:
- Vertical-scale the database before you shard. A larger instance is cheaper and simpler than a sharding migration.
- Favor observability over optimization. You can’t optimize what you can’t measure, and good telemetry pays dividends at every growth stage.
- Keep autoscale scale-in policies conservative. An extra idle instance costs a few dollars. A 503 storm during a traffic spike costs users and trust.
- Treat each phase transition as a deliberate architectural decision, not a reaction to an incident. The teams that scale well plan the next phase while the current one is still comfortable.
Ctrlaltorion builds the scaling infrastructure you need
When your app is under load and your team is stretched thin, the gap between knowing what to do and having the capacity to do it safely is where incidents happen. Ctrlaltorion delivers end-to-end scaling engagements for small businesses and growing startups: architecture audits, database migrations, caching and CDN setup, Kubernetes deployments, and CI/CD pipelines, all scoped to your actual traffic and budget rather than a generic enterprise playbook.
The difference from a traditional agency is the model: project-based engagements with no long-term retainer required, direct access to the engineers doing the work, and a handover that leaves your team owning the system. Clients have seen reporting infrastructure go from hours to minutes. That kind of outcome comes from fixing the right thing in the right order, not from adding infrastructure for its own sake.
If your app is showing the signals described in this article, start with a discovery conversation. Talk to Ctrlaltorion about your current setup and get a prioritized action list you can act on immediately.
What Ctrlaltorion offers teams ready to scale
When the architecture audit is done and the prioritized backlog is clear, execution speed and operational confidence are what separate a smooth scaling project from a production incident. Ctrlaltorion provides custom software development for small businesses and growing startups, covering the full stack of scaling work: database migrations, caching layer setup, Kubernetes deployments, CI/CD pipelines, and monitoring configuration.
Engagements are project-based, scoped to your actual needs, and structured so your team owns the system at handover. No long-term contracts, no generic playbooks. If your app is showing the signals this article describes, a discovery conversation with Ctrlaltorion is the fastest way to get a prioritized action list and a realistic cost estimate for your specific setup.
Sources
3 refsThe sources below cover the specific techniques referenced throughout this article. Each is worth reading in full for the topic it covers best.
- Horizontal vs. vertical scaling: how they compare & what they costcloudzero.com
- Application Scale: Key Concepts and Strategiesaerospike.com
- How to Build a Scalable Web Application in 2026weweb.io
Tools to research further:
comments
loading comments…
No comments yet. Start the thread.